
The AI Trade: Opportunity Or Warning?
Authored by Lance Roberts via RealInvestmentAdvice.com,
AI Trade Lives On As “Santa Rally” Comes Into View
The markets experienced another volatile trading week as we head into a shortened trading week due to the Thanksgiving holiday. The S&P 500 and Nasdaq both closed the week lower, but rallied on Friday as options expiration took hold. The consistent selling pressure in AI and semiconductor-related stocks had reversed previous overbought conditions enough for a bounce. The big news was Nvidia’s earnings. Despite the market’s poor reaction (a very normal response following its earnings report), the numbers were stellar.
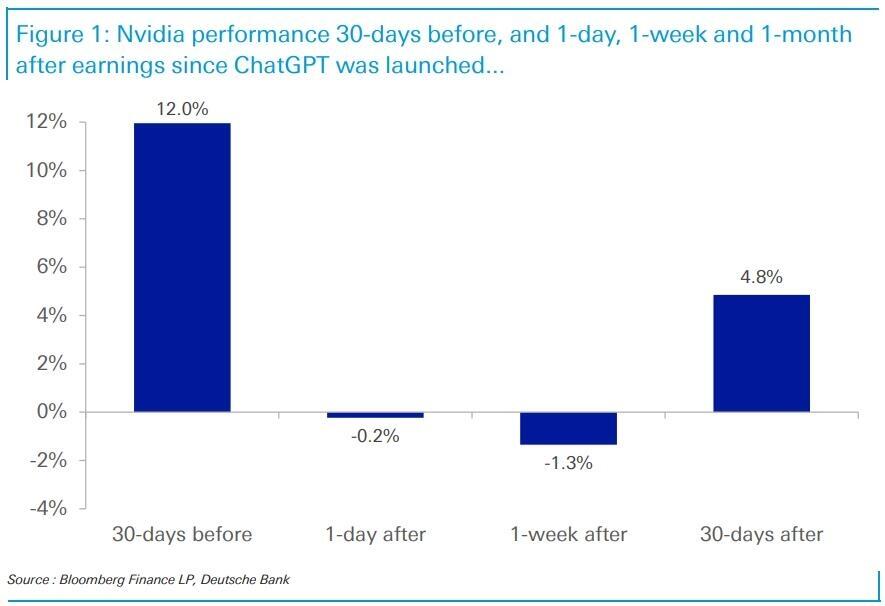
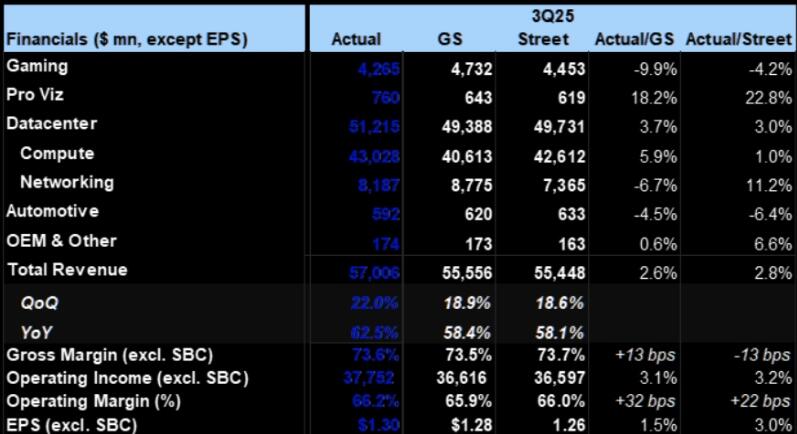
Nvidia’s earnings beat didn’t just meet expectations; it crushed them on nearly every metric. Revenue jumped 34% quarter over quarter, with data center sales up 41%. Demand for high-performance GPUs continues to outpace supply, and CEO Jensen Huang dismissed fears of a bubble, saying, “This is the beginning of a new industrial revolution.” That quote made the rounds for good reason. The stock’s post-earnings surge lifted the entire tech complex and added another leg to the year’s dominant trade: AI infrastructure.
Importantly, Nvidia’s numbers were more than a sentiment boost. They were confirmation that capital expenditures in AI, particularly by the largest tech platforms, remain robust. Microsoft, Amazon, and Meta are all spending aggressively on AI buildouts, and Nvidia sits at the center of that spend. That’s why the stock’s move matters: it’s not just about one company, it’s a read-through on the entire AI supply chain.
On the macro side, the data flow stayed supportive. Jobless claims ticked up slightly, but not enough to suggest deterioration. Inflation expectations, as measured by both breakevens and consumer surveys, remained anchored. Bond yields eased modestly, allowing equities more breathing room. This backdrop checks the boxes on what Nomura refers to as the “Santa Rally” setup: cooling inflation, stable employment, improving liquidity, and no immediate Fed pushback.
Still, not all signals are green. Valuations, particularly in the tech sector, remain elevated, with the forward P/E ratio on the Nasdaq 100 above 25x, significantly higher than historical averages. Meanwhile, earnings growth has slowed in some areas. The market is clearly pricing in an ideal scenario, continued growth, disinflation, and no policy mistakes. That leaves little room for error.
Heading into December, the seasonal tailwinds remain intact, as noted above. December is historically the best month for equities, with the “Santa Claus rally” often delivering average gains of 1.5% to 2.0%. With corporate buybacks in full swing, adding $5-6 billion in daily volume, investor positioning remaining stable, and professional managers underweight in exposure, particularly in technology companies, the fuel for a rally is present. However, the market also remains fragile due to poor underlying breadth and rising volatility, so caution is advised.
The near-term outlook is constructive, provided the Fed remains quiet and bond volatility remains contained. But any surprise, in inflation, growth, or geopolitics, could shift sentiment quickly. The key for investors is discipline. Don’t chase the rally blindly. Stick to quality, stay diversified, and use elevated prices to trim into strength where appropriate. While the potential for a year-end rally is higher after the recent correction, nothing is guaranteed.
Let’s review the technical backdrop.
📈Technical Backdrop – Breadth Tumbles
The bullish run of the past few weeks lost its footing as the S&P 500 closed back below its 50-day moving average, ending the week at 6,603. That break is notable. This level, which had previously served as reliable support since the late October low, gave way under broad selling pressure across sectors. Volume picked up on the move lower, and market breadth weakened significantly, with relative strength and breadth remaining very weak. Furthermore, money flows show the shift from accumulation to distribution.
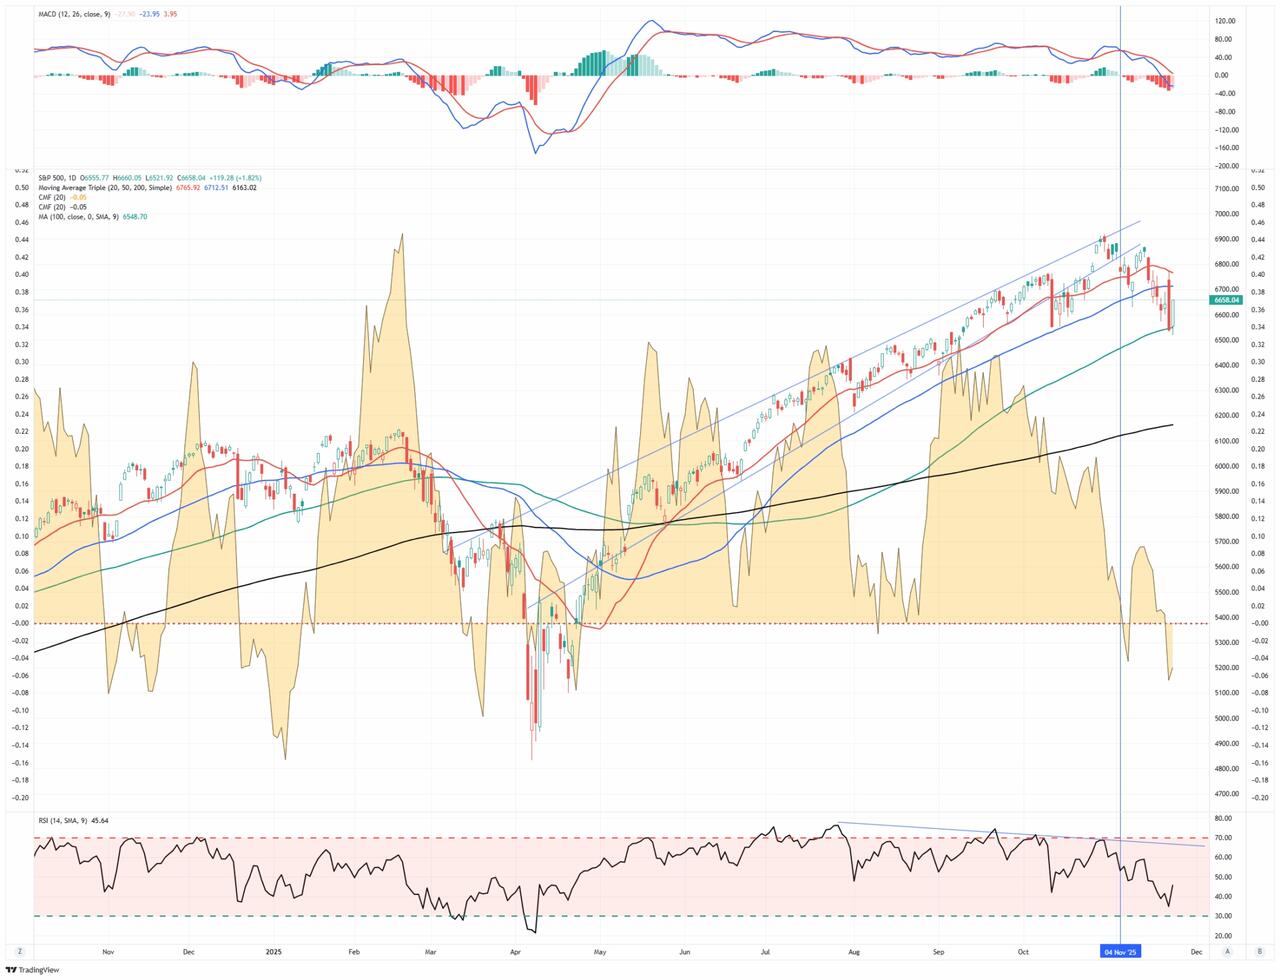
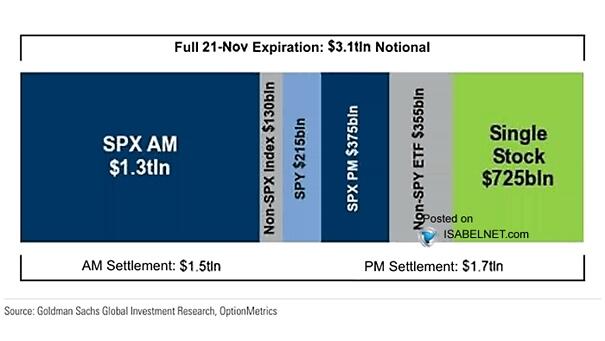
From a technical standpoint, the index broke below the 50-day moving average, a key support level, and fell to the 100-day moving average during Thursday’s market reversal. While there was much speculation about why the market reversed so significantly on Thursday, most of that reversal was likely due to positioning changes ahead of the options expiration on Friday, which was the largest November expiration on record.
While Friday’s strong bounce of the 100-day moving average is encouraging, we are not out of the woods just yet. As noted above, relative strength and breadth continue to be a concern. Should the 100-day moving average not hold, the next area of support sits around the 200-day moving average near 6,163. However, for now, the current pullback remains within a larger bullish structure, but pressure is mounting that should not be dismissed.
Other markets did not escape the selling pressure this past week. The Nasdaq Composite saw downside follow-through, losing nearly 2.75% on the week and closing back below short-term support levels. The AI-related stock basket declined by more than 5%, while Bitcoin fell by almost 10%. Overall, it was a tough week for investors, but the good news is that most markets are now decently oversold, which is enough for a bounce.
We suggest that investors who struggled emotionally during the recent selloff reassess their positioning. If you found the drawdown difficult to handle, take some action:
-
Trim Back to Your Risk Tolerance: If the recent decline caused panic or second-guessing, it’s a signal your risk exposure may be too high. Use the bounce to reduce position sizes in volatile or high-beta names. Rebuild your portfolio around positions you can hold through 10–15% corrections without emotional strain. Don’t wait for another leg down to adjust.
-
Raise Cash Strategically: Cash is not a missed opportunity — it’s optionality. If you had no flexibility during the decline, use the rally to raise some cash. Trim weaker positions or those that only work in one market scenario. A 10–20% cash allocation gives you the ability to buy future dips rather than sell into fear.
-
Reassess Asset Allocation: Market pullbacks test more than individual stock picks — they expose flaws in allocation. Were you too tech-heavy? Too concentrated? Use this bounce to shift into a more balanced mix of growth, value, and defensives. Ensure your exposure isn’t overly reliant on a single theme, such as AI, small caps, or speculative sectors.
-
Review Your Exit and Stop Levels: The last two weeks exposed the cost of not having an exit plan. Use this rally to establish or tighten stop-loss levels based on support/resistance — not emotion. Define your max risk per trade or position and write it down. If the market weakens again, you’ll respond with rules, not reactions.
-
Document What Went Wrong: Use this bounce as a debrief. What specifically made you uncomfortable during the decline? Was it overexposure, leverage, position sizing, or lack of diversification? Write it out. Then build a checklist for your following trades or allocations. Market stress is unavoidable, but self-inflicted damage can be minimized with better preparation.
This is not the time to chase losses or gamble on full recovery. Use strength to reposition with discipline and clarity. Let the market work for you, not against your temperament.
💰 AI Trade Falters
The recent market correction places the “AI trade” under intense scrutiny. Stocks tied to artificial‑intelligence infrastructure, software, and platforms have pulled back, signalling more than a simple sentiment swing. According to Reuters, “investors are fretting over the pace of rate cuts and pricey valuations of heavyweight artificial‑intelligence stocks that have fueled much of the rally.” However, beyond valuation concerns lies a more profound problem: mounting debt issuance and rising credit default-swap (CDS) spreads in key AI-leveraged firms.
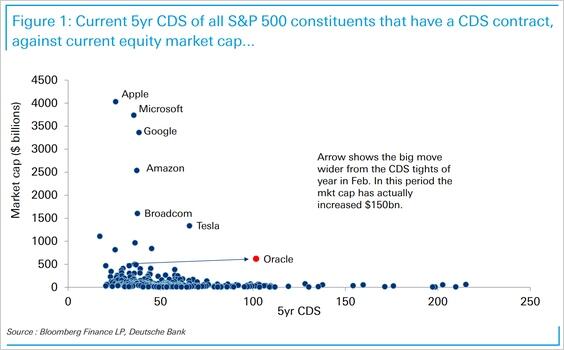
Recently, the credit markets have been flashing warning signs. For example, the 5‑year CDS spread for Oracle Corporation has surged to over 100 basis points, up markedly from earlier this year, reflecting increased cost to insure its debt. The trading volume in CDS tied to AI sector debt increased to approximately $4.2 billion over a recent six-week period.
As we discussed in our #DailyMarketCommentary,
“CDS stands for credit default swaps. These are derivative contracts in which one party, the default protection buyer, pays a quarterly fee, expressed in basis points. In return, the counterparty, or protection provider, assures that in the event of default, the buyer will receive par for their bonds. CDS spreads, or the cost of default insurance, provide the market with an easy way to quantify the implied market default probability. While simplified, here is the math to calculate default risk:”
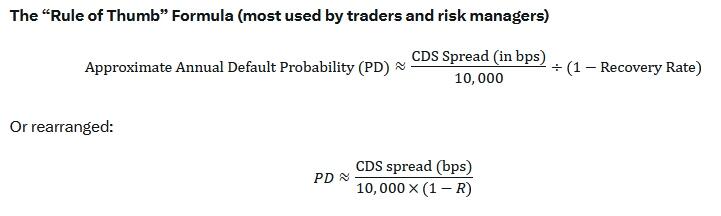
Essentially, the formula divides the cost of insurance by the bond’s par value less the recovery rate. The recovery rate represents the percentage of the bondholders’ investment that will be recovered in the event of default. Often, the market assumes only a 30- to 40-cent recovery of the original investment. Therefore, if we apply that math to the five-year Oracle and CoreWeave CDS spreads, and assuming a 35% default recovery, we get the following annual default probabilities.
- Oracle CDS 108 bps: 108 / (10,000*(1-0.35)) = 1.66%
- CoreWeave CDS 675 bps: 675 / (10,000*(1-0.35)) = 10.38%
In other words, despite the fear-mongering of the media, default risks remain exceptionally low. So, why this spike? Because tech firms are raising huge sums to build AI data centres and platforms, which took the markets a bit by surprise. Oracle alone plans a $38 billion debt raise and could see net debt near $290 billion by 2028.
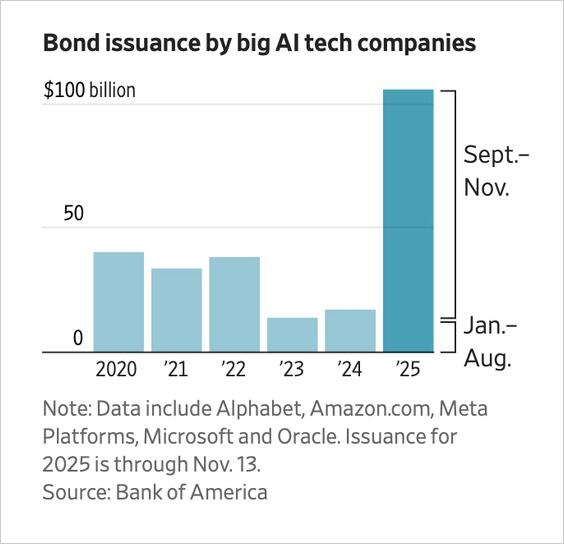
The increased leverage introduces refinancing and interest-rate risks, which were previously mostly nonexistent. While the “Mega-cap” companies have large free cash flows, a rising concern is that they are “over-investing” in the future.
“For the first time since Aug’05, a majority (net 20%) of FMS investors say companies are overinvesting; this jump is driven by concerns over the magnitude & financing of the AI capex boom.” – BofA
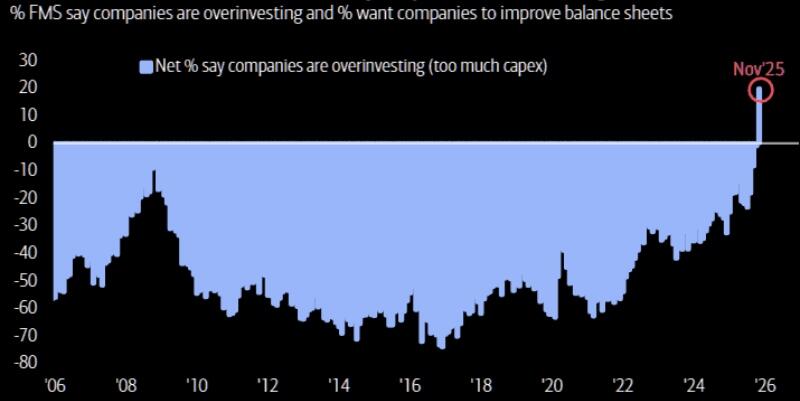
These are companies counting on large future cash flows to justify their expenditures and debt loads. When investors buy CDS protection, it means they assign a non-trivial probability to default or distress. That signals the market’s growing caution toward the AI growth narrative. Therefore, it is understandable why the recent correction in the “AI trade” has been more than just a minor fluctuation. It is reflecting investors’ demand for proof regarding execution, earnings, and balance-sheet resilience.
From an investor’s viewpoint, this means determining whether the current correction is genuinely a “thesis shift” or just a long-overdue price correction. The AI trade that powered recent rallies was built on promise and narrative. Now, the same firms are being evaluated on their ability to convert that promise into profits while managing sizable debt burdens in a higher interest rate environment.
These concerns raise a critical question.
Is the recent equity sell‑off an early warning or an entry point?
Opportunity or Warning?
The structural opportunity for the “AI trade” remains substantial. According to a report from McKinsey & Company, generative AI and other advanced AI use cases could unlock as much as $4.4 trillion in productivity gains for business users alone. Meanwhile, research from S&P Global Market Intelligence indicates that the market for code‑generation tools is projected to grow at a compound annual growth rate (“CAGR”) of about 53% from 2024 to 2029.
These data points underscore a broad expectation: companies that adopt AI at scale will see top‑line growth and cost efficiency improvements. Another research piece from the Boston Consulting Group shows that the adoption of “agentic AI” is set to rise from 17% of total AI value in 2025 to 29% by 2028, suggesting a transition from pilot phases to genuine business deployments. Further adding to the opportunity, the Bank of England has flagged that between 2025 and 2028, AI infrastructure capital expenditure may reach as high as $2.9 trillion, with roughly $1.5 trillion of that coming from external capital sources.
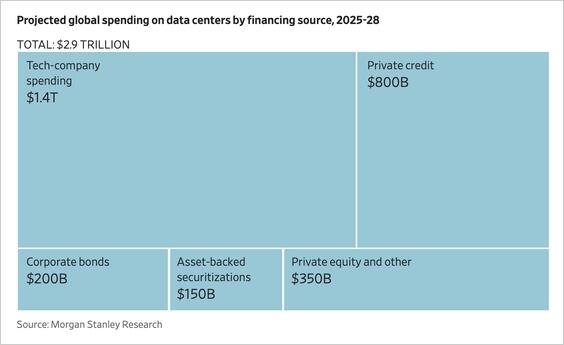
While debt is being used to build data centers, that same debt is “productive” and will boost economic growth, which in turn increases revenues to these companies from increased demand. For more on the impact of spending on economic growth, you can read:
Further supporting the bull case, Nvidia’s recent earnings shattered expectations. The company reported record sales and raised its guidance again, with CEO Jensen Huang explicitly rejecting the notion of an AI bubble.
“We are at the beginning of a new computing era. What we see is not hype. It’s real, broad-based demand across nearly every industry.” – CNBC
Demand for GPUs remains so high that hardware is selling out despite increased supply, a sign that adoption is continuing at a substantial pace. These fundamentals suggest that companies correctly positioned in the AI ecosystem may experience significant increases in revenue and cash flow. For example, platforms that host AI workloads, chipmakers who supply the infrastructure, and software vendors who embed AI into enterprise applications could all benefit from a multi-year growth phase. Given that many firms are still in the early stages of monetizing their AI investments, the long-term horizon remains favorable. In other words, if this thesis