
Mapping US Income Inequality By State
The wealth of America’s top 1% sits around $52 trillion today, rising by $4 trillion over the year.
Overall, the top 1% of U.S. earners need to make around $800,000 or more in salary per household.
Meanwhile, about 30% of American households earned less than $50,000 last year, highlighting clear divides in wage distribution across the country.
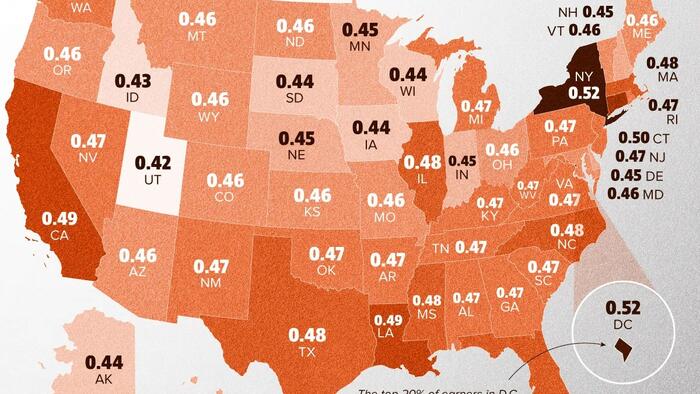
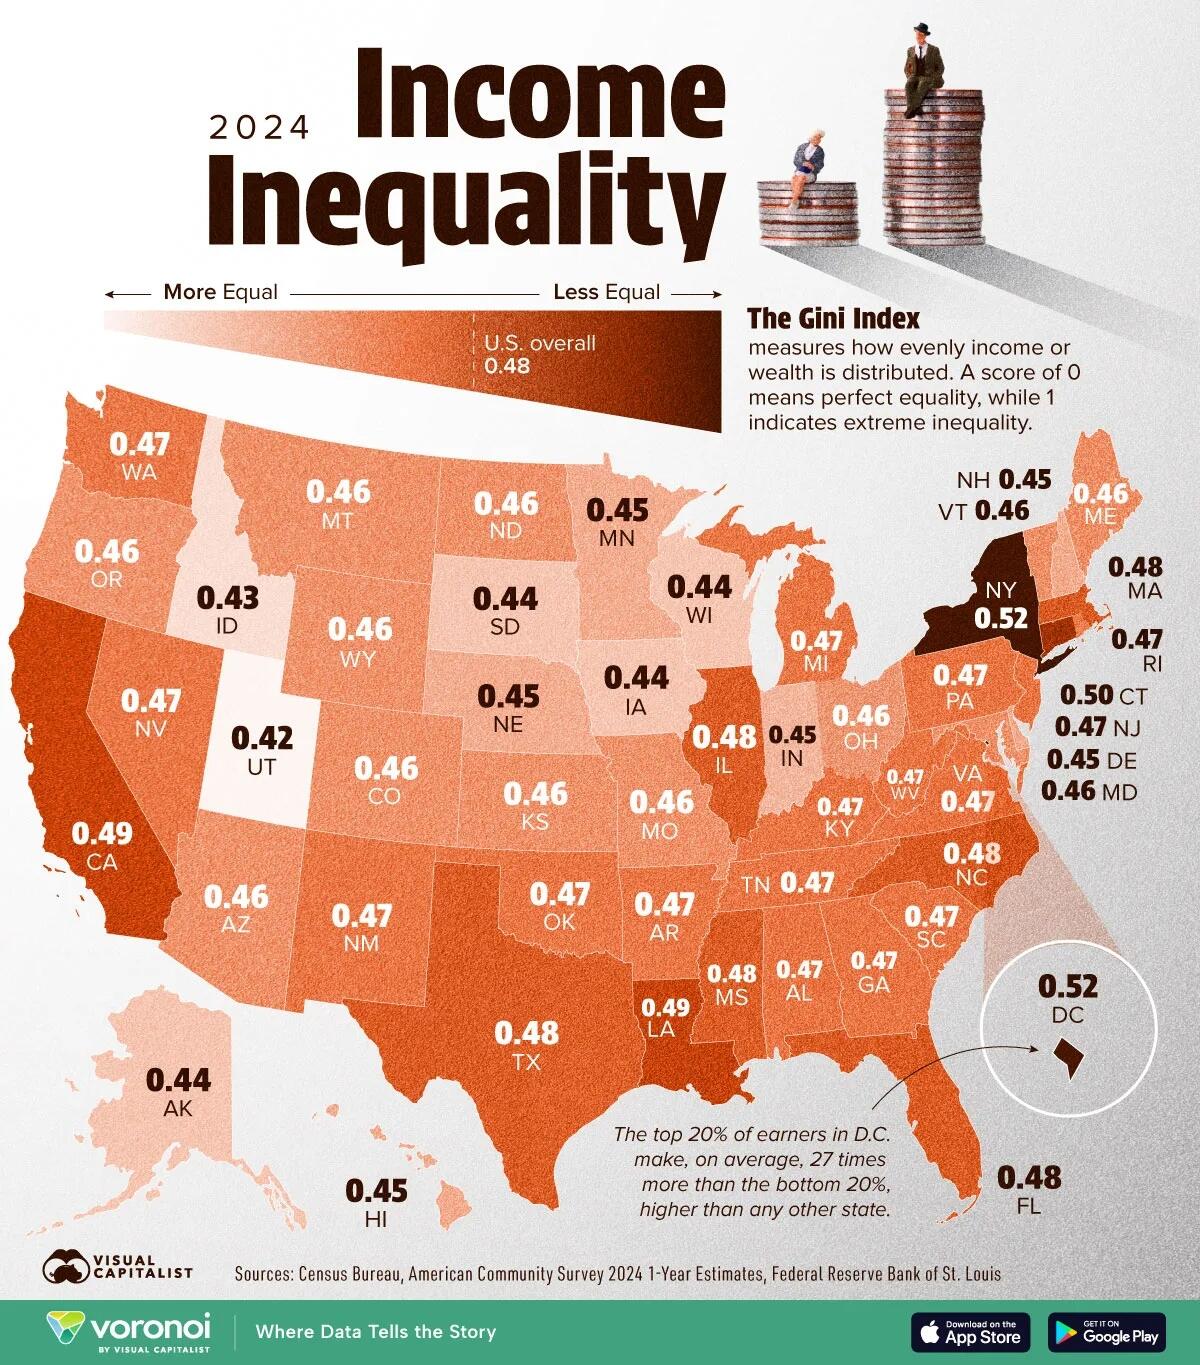
This graphic, via Visual Capitalist's Dorothy Neufeld, shows income inequality by state, based on data from the U.S. Census Bureau.
The Spectrum of Income Inequality in America
In 2024, the U.S. Gini coefficient was 0.48, representing a high degree of inequality.
Effectively, a score of one means that a single person would earn all of the income, and 0 would represent perfect equality. Last year, the top 20% of earners pocketed 52.2% of the country’s income according to the U.S. Census Bureau. In contrast, the bottom fifth of earners received just 3.1%.
Yet, income is distributed differently across states. Last year, income inequality was the most severe in Washington, D.C. and New York, each with a 0.52 Gini index score.
| State | Gini Coefficient 2024 |
|---|---|
| District of Columbia | 0.52 |
| New York | 0.52 |
| Connecticut | 0.50 |
| Louisiana | 0.49 |
| California | 0.49 |
| Massachusetts | 0.48 |
| Illinois | 0.48 |
| Florida | 0.48 |
| Texas | 0.48 |
| North Carolina | 0.48 |
| Mississippi | 0.48 |
| Pennsylvania | 0.47 |
| Tennessee | 0.47 |
| Alabama | 0.47 |
| Georgia | 0.47 |
| Washington | 0.47 |
| New Mexico | 0.47 |
| Arkansas | 0.47 |
| Rhode Island | 0.47 |
| New Jersey | 0.47 |
| Kentucky | 0.47 |
| Oklahoma | 0.47 |
| Virginia | 0.47 |
| Michigan | 0.47 |
| West Virginia | 0.47 |
| South Carolina | 0.47 |
| Nevada | 0.47 |
| Missouri | 0.46 |
| Ohio | 0.46 |
| Arizona | 0.46 |
| Colorado | 0.46 |
| Wyoming | 0.46 |
| Montana | 0.46 |
| North Dakota | 0.46 |
| Maine | 0.46 |
| Maryland | 0.46 |
| Kansas | 0.46 |
| Oregon | 0.46 |
| Vermont | 0.46 |
| Hawaii | 0.45 |
| Indiana | 0.45 |
| Minnesota | 0.45 |
| Delaware | 0.45 |
| New Hampshire | 0.45 |
| Nebraska | 0.45 |
| South Dakota | 0.44 |
| Wisconsin | 0.44 |
| Alaska | 0.44 |
| Iowa | 0.44 |
| Idaho | 0.43 |
| Utah | 0.42 |
In Washington, D.C. the top 20% of earners made 27 times more than the bottom 20% in 2023 according to the Federal Reserve Bank of St. Louis, which is the highest ratio of any state between the top and bottom quintiles.
New York, on the other hand, is home to more billionaires than any other state except for California, creating huge disparities in income. Since 2019, real wage growth among the Big Apple’s top 3% soared 34.5%, more than triple all other income tiers.
Falling near the U.S. average are Florida, Texas, and Massachusetts, providing a more representative picture of income inequality in the country.
In comparison, Utah ranks lowest overall, a position it has regularly held for some time. Utah has the sixth-highest employment share (65.4%) in the country, keeping average family incomes more even.
Along with this, Utah has one of the best social mobility index scores nationwide, likely influenced by narrower wage disparities.
To learn more about this topic, check out this graphic on wealth inequality by country in 2025.
Tyler Durden
Sun, 12/07/2025 – 21:35