
Mapping Global Real Estate Bubble Risk In 2025
Globally, real estate markets have been cooling over the last few years, with high mortgage rates and unaffordable prices affecting demand in many cities.
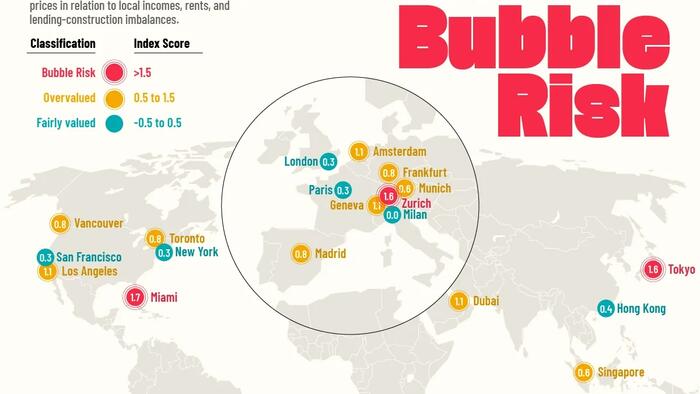
However, while housing bubble risks have eased across many markets, home prices in real estate hotspots like Miami and Tokyo continue to rise, inflating their bubble risk.
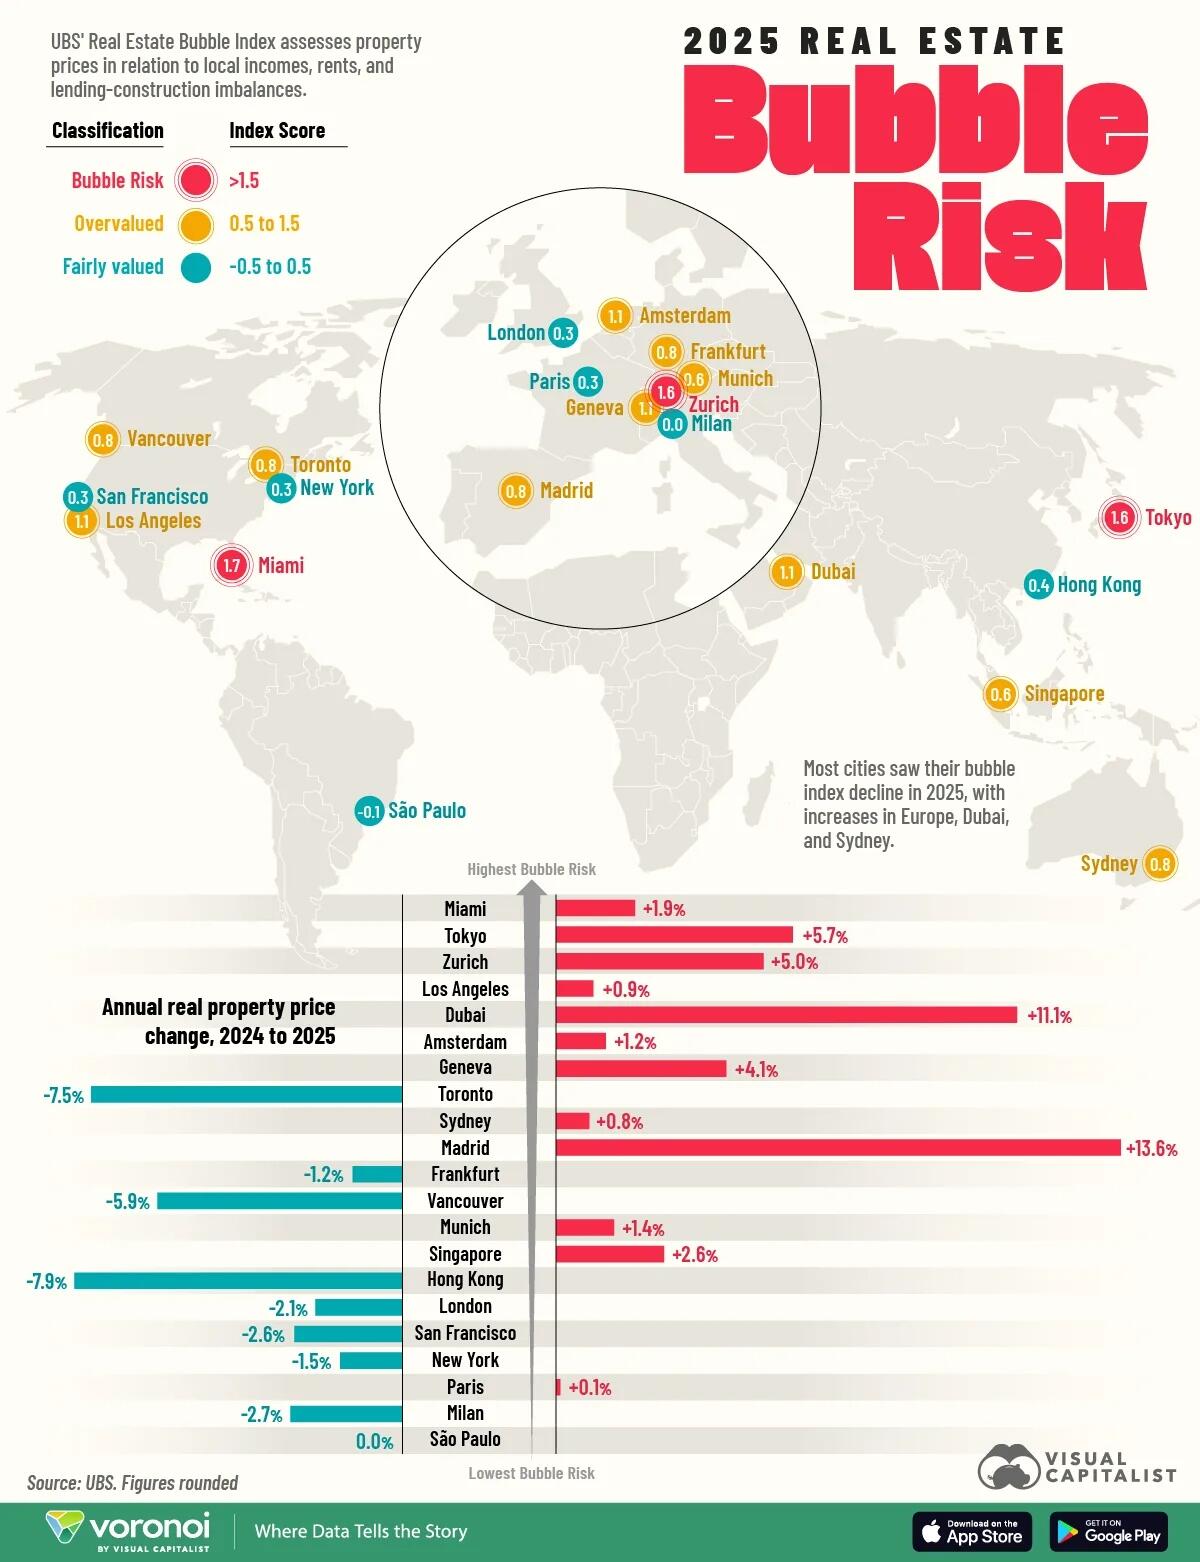
This infographic, via Visual Capitalist's Niccolo Conte, shows the cities with the highest bubble risk worldwide based on the UBS Global Real Estate Bubble Index 2025.
Where Housing Markets Look Most Overheated
UBS’ Real Estate Bubble Index evaluates housing markets around the world using a range of indicators, including price-to-income ratios, price-to-rent ratios, and trends in mortgage lending and construction activity.
Cities are classified into three broad categories based on their index score:
- Bubble Risk: >1.5
- Overvalued: 0.5 to 1.5
- Fairly Valued: -0.5 to 0.5
Below is the full 2025 ranking of cities by UBS’s Bubble Index score, along with the annual real price change:
| Rank | City | Bubble Risk Index Score | Annual real home price change (2024 to 2025) |
|---|---|---|---|
| 1 | Miami | 1.73 | 1.9% |
| 2 | Tokyo | 1.59 | 5.7% |
| 3 | Zurich | 1.55 | 5.0% |
| 4 | Los Angeles | 1.11 | 0.9% |
| 5 | Dubai | 1.09 | 11.1% |
| 6 | Amsterdam | 1.06 | 1.2% |
| 7 | Geneva | 1.05 | 4.1% |
| 8 | Toronto | 0.8 | -7.5% |
| 9 | Sydney | 0.8 | 0.8% |
| 10 | Madrid | 0.77 | 13.6% |
| 11 | Frankfurt | 0.76 | -1.2% |
| 12 | Vancouver | 0.76 | -5.9% |
| 13 | Munich | 0.64 | 1.4% |
| 14 | Singapore | 0.55 | 2.6% |
| 15 | Hong Kong | 0.44 | -7.9% |
| 16 | London | 0.34 | -2.1% |
| 17 | San Francisco | 0.28 | -2.6% |
| 18 | New York | 0.26 | -1.5% |
| 19 | Paris | 0.25 | 0.1% |
| 20 | Milan | 0.01 | -2.7% |
| 21 | São Paulo | -0.1 | 0.0% |
The majority of cities in the index saw their bubble risk decline since 2024, with Toronto and Hong Kong experiencing the largest drops.
However, bubble risk rose in Miami, which ranks highest with an index score of 1.73, supported by rising home prices. Tokyo and Zurich also sit above the critical 1.5 threshold.
Meanwhile, several real estate markets fall into the overvalued range but remain below the bubble-risk territory. These include Madrid, which saw the strongest rise in real home prices, up 13.6% from 2024 to 2025.
Dubai is another notable city in the overvalued bucket, with prices rising by over 11% year-over-year. According to UBS, average real prices in Dubai have grown by around 50% over the last five years. However, prices could potentially cool off in 2026 following a record increase in supply.
Where Real Estate Bubble Risk Declined in 2025
Several housing markets are undergoing corrections after the post-pandemic uproar in prices.
Toronto, one of the world’s most unaffordable housing markets, has seen its bubble risk score fall sharply, accompanied by a -7.5% real home price decline. Hong Kong saw an even larger drop in price levels, at -7.9%, pushing it into the fairly-valued category.
Other cities, including Vancouver, Frankfurt, London, and San Francisco, also reported price declines as affordability constraints and higher borrowing costs weighed on demand.
To learn more about this topic, see this graphic on the world’s most expensive housing markets on Voronoi.
Tyler Durden
Fri, 11/28/2025 – 04:15