
Visualizing The Declining Purchasing Power Of The US Dollar
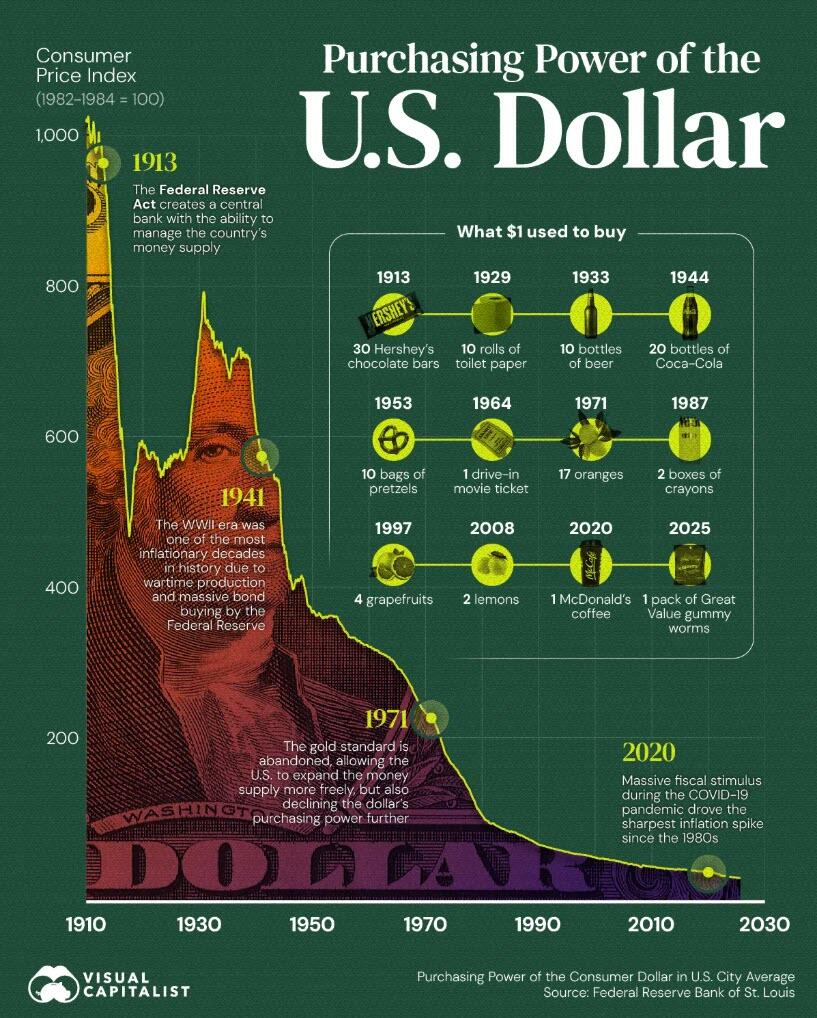
The U.S. dollar has steadily lost value over the past century. According to Federal Reserve data, the purchasing power of one dollar today is equal to just a few cents in 1913 (the year the Fed was created).
In this graphic, Visual Capitalist's Marcus Lu tracks the decline in the purchasing power of the U.S. dollar since the early 1900s, illustrating how inflation has eroded its value.
Data & Discussion
The data for this visualization comes from Federal Reserve Economic Data (FRED). It measures the “Purchasing Power of the Consumer Dollar” across all U.S. city averages, indexed to consumer prices.
The higher the index, the more purchasing power the dollar has. As the index declines, goods and services become relatively more expensive.
| Date | Purchasing Power of the Consumer Dollar in U.S. City Average |
|---|---|
| 1913-01-01 | 1017.8 |
| 1914-01-01 | 994.2 |
| 1915-01-01 | 987.6 |
| 1916-01-01 | 956.2 |
| 1917-01-01 | 855 |
| 1918-01-01 | 715.9 |
| 1919-01-01 | 604.5 |
| 1920-01-01 | 517.7 |
| 1921-01-01 | 524.9 |
| 1922-01-01 | 590.2 |
| 1923-01-01 | 595 |
| 1924-01-01 | 578.8 |
| 1925-01-01 | 577.9 |
| 1926-01-01 | 557.3 |
| 1927-01-01 | 570.1 |
| 1928-01-01 | 578.8 |
| 1929-01-01 | 584.5 |
| 1930-01-01 | 584.5 |
| 1931-01-01 | 628.8 |
| 1932-01-01 | 699.1 |
| 1933-01-01 | 775.4 |
| 1934-01-01 | 755.7 |
| 1935-01-01 | 733.5 |
| 1936-01-01 | 722.8 |
| 1937-01-01 | 709.3 |
| 1938-01-01 | 702.4 |
| 1939-01-01 | 715.9 |
| 1940-01-01 | 717.7 |
| 1941-01-01 | 709.3 |
| 1942-01-01 | 638.1 |
| 1943-01-01 | 591.4 |
| 1944-01-01 | 574.3 |
| 1945-01-01 | 561.4 |
| 1946-01-01 | 549.2 |
| 1947-01-01 | 464.8 |
| 1948-01-01 | 421.4 |
| 1949-01-01 | 415.7 |
| 1950-01-01 | 424.4 |
| 1951-01-01 | 393.2 |
| 1952-01-01 | 377.4 |
| 1953-01-01 | 375 |
| 1954-01-01 | 370.8 |
| 1955-01-01 | 373.5 |
| 1956-01-01 | 372.6 |
| 1957-01-01 | 361.5 |
| 1958-01-01 | 349.3 |
| 1959-01-01 | 344.8 |
| 1960-01-01 | 340.6 |
| 1961-01-01 | 335.2 |
| 1962-01-01 | 332.8 |
| 1963-01-01 | 328.6 |
| 1964-01-01 | 323.2 |
| 1965-01-01 | 319.6 |
| 1966-01-01 | 313.6 |
| 1967-01-01 | 303.5 |
| 1968-01-01 | 293.3 |
| 1969-01-01 | 280.4 |
| 1970-01-01 | 264.3 |
| 1971-01-01 | 251.1 |
| 1972-01-01 | 243 |
| 1973-01-01 | 234.3 |
| 1974-01-01 | 214.3 |
| 1975-01-01 | 191.8 |
| 1976-01-01 | 179.6 |
| 1977-01-01 | 170.6 |
| 1978-01-01 | 159.8 |
| 1979-01-01 | 146.3 |
| 1980-01-01 | 128.4 |
| 1981-01-01 | 114.9 |
| 1982-01-01 | 105.9 |
| 1983-01-01 | 102.1 |
| 1984-01-01 | 98.2 |
| 1985-01-01 | 94.6 |
| 1986-01-01 | 91.3 |
| 1987-01-01 | 89.9 |
| 1988-01-01 | 86.4 |
| 1989-01-01 | 82.6 |
| 1990-01-01 | 78.5 |
| 1991-01-01 | 74.3 |
| 1992-01-01 | 72.4 |
| 1993-01-01 | 70.1 |
| 1994-01-01 | 68.4 |
| 1995-01-01 | 66.5 |
| 1996-01-01 | 64.8 |
| 1997-01-01 | 62.8 |
| 1998-01-01 | 61.9 |
| 1999-01-01 | 60.8 |
| 2000-01-01 | 59.2 |
| 2001-01-01 | 57.1 |
| 2002-01-01 | 56.5 |
| 2003-01-01 | 55 |
| 2004-01-01 | 54 |
| 2005-01-01 | 52.4 |
| 2006-01-01 | 50.4 |
| 2007-01-01 | 49.4 |
| 2008-01-01 | 47.4 |
| 2009-01-01 | 47.4 |
| 2010-01-01 | 46.1 |
| 2011-01-01 | 45.4 |
| 2012-01-01 | 44.1 |
| 2013-01-01 | 43.4 |
| 2014-01-01 | 42.8 |
| 2015-01-01 | 42.8 |
| 2016-01-01 | 42.2 |
| 2017-01-01 | 41.2 |
| 2018-01-01 | 40.3 |
| 2019-01-01 | 39.7 |
| 2020-01-01 | 38.8 |
| 2021-01-01 | 38.2 |
| 2022-01-01 | 35.6 |
| 2023-01-01 | 33.4 |
| 2024-01-01 | 32.4 |
| 2025-01-01 | 31.5 |
| 2025-09-01 | 30.8 |
Inflationary Eras and Economic Shocks
Major inflationary periods can be identified by looking at the steepest drops in the chart. For example, World War I and World War II strained government finances, leading to massive increases in public spending and money creation, which pushed prices sharply higher.
Similarly, the oil shocks of the 1970s caused energy costs to spike throughout the world, feeding into broad-based inflation. In each case, rising prices significantly eroded the purchasing power of the U.S. dollar.
From Gold Standard to Fiat Currency
Until 1971, the U.S. dollar was backed by gold.
This system was ended by President Nixon because the U.S. was creating more dollars than it had gold to support. Furthermore, foreign countries were increasingly demanding gold in exchange for their dollar reserves.
While ending this system gave policymakers more flexibility to manage the economy, money creation became easier, as shown by this chart of the M2 money supply. M2 comprises the most liquid forms of U.S. money, including physical currency, checking deposits, plus near-liquid assets like small-value time (CD) deposits, retail money-market funds, and other readily convertible savings vehicles.
An expanding money supply can be healthy when it grows in line with factors like population, economic output, and demand for credit, but becomes inflationary when it outpaces real economic growth.
If you enjoyed today’s post, check out Gold Production by Region in 2024 on Voronoi, the new app from Visual Capitalist.
Tyler Durden
Tue, 12/02/2025 – 05:45