
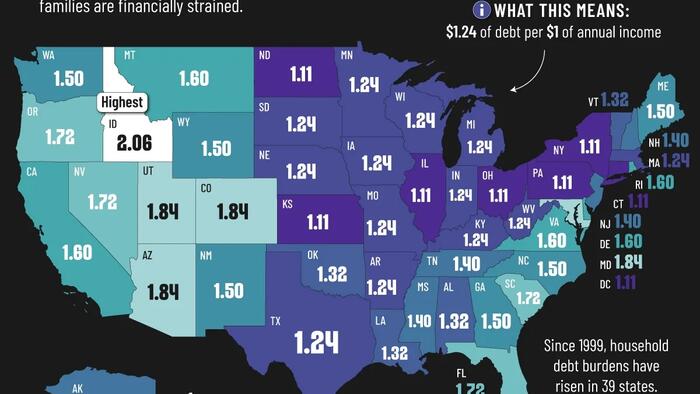
Where US Families Are Most Strained By Debt
Americans are always worrying about debt: their own and their government’s.
This visualization, via Visual Capitalist's Pallavi Rao, maps each state by their household debt-to-income ratios (DTI) in Q1, 2025, revealing which states carry the heaviest burdens and which ones keep borrowing in check.
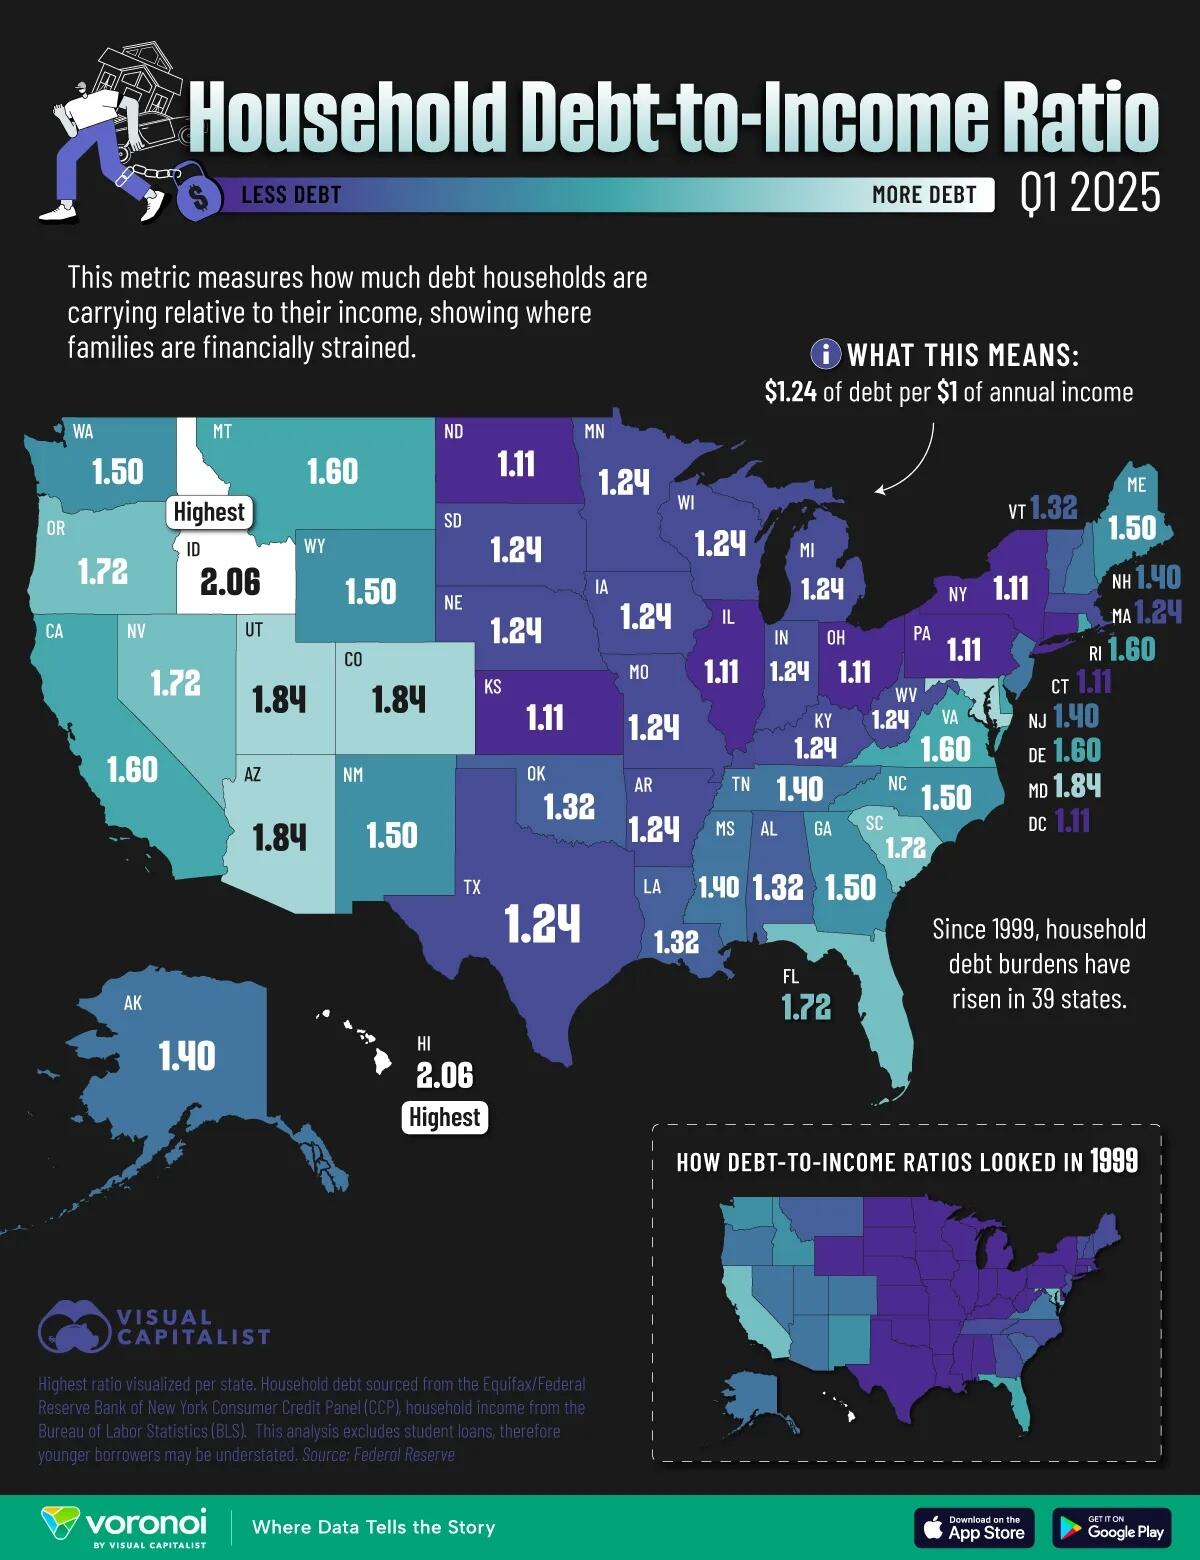
Data for this visualization comes from the Federal Reserve. The highest ratio is visualized per state.
ℹ️ Debt includes mortgages, autos, credit cards, etc., and excludes student loans. Income is based on unemployment insurance-covered wages, as reported to the Bureau of Labor Statistics.
Which States Carry the Most Debt?
Two states share the top spot: Idaho and Hawaii both post a DTI of 2.06, meaning households owe just over twice their annual after-tax income.
| Rank | State | State Code | Debt-to-Income Ratio (2025) | Debt-to-Income Ratio (1999) | 1999–2025 Change |
|---|---|---|---|---|---|
| 1 | Idaho | ID | 2.06 | 1.50 | 0.56 |
| 2 | Hawaii | HI | 2.06 | 2.06 | 0.00 |
| 3 | Arizona | AZ | 1.84 | 1.40 | 0.44 |
| 4 | Colorado | CO | 1.84 | 1.40 | 0.44 |
| 5 | Utah | UT | 1.84 | 1.40 | 0.44 |
| 6 | Maryland | MD | 1.84 | 1.72 | 0.12 |
| 7 | South Carolina | SC | 1.72 | 1.32 | 0.40 |
| 8 | Nevada | NV | 1.72 | 1.40 | 0.32 |
| 9 | Oregon | OR | 1.72 | 1.40 | 0.32 |
| 10 | Florida | FL | 1.72 | 1.60 | 0.12 |
| 11 | Delaware | DE | 1.60 | 1.11 | 0.49 |
| 12 | Montana | MT | 1.60 | 1.32 | 0.28 |
| 13 | Rhode Island | RI | 1.60 | 1.32 | 0.28 |
| 14 | Virginia | VA | 1.60 | 1.40 | 0.20 |
| 15 | California | CA | 1.60 | 1.72 | -0.12 |
| 16 | Wyoming | WY | 1.50 | 1.11 | 0.39 |
| 17 | Georgia | GA | 1.50 | 1.24 | 0.26 |
| 18 | Maine | ME | 1.50 | 1.24 | 0.26 |
| 19 | North Carolina | NC | 1.50 | 1.24 | 0.26 |
| 20 | New Mexico | NM | 1.50 | 1.50 | 0.00 |
| 21 | Washington | WA | 1.50 | 1.50 | 0.00 |
| 22 | Mississippi | MS | 1.40 | 1.11 | 0.29 |
| 23 | New Hampshire | NH | 1.40 | 1.24 | 0.16 |
| 24 | New Jersey | NJ | 1.40 | 1.24 | 0.16 |
| 25 | Tennessee | TN | 1.40 | 1.24 | 0.16 |
| 26 | Alaska | AK | 1.40 | 1.32 | 0.08 |
| 27 | Alabama | AL | 1.32 | 1.11 | 0.21 |
| 28 | Louisiana | LA | 1.32 | 1.11 | 0.21 |
| 29 | Oklahoma | OK | 1.32 | 1.11 | 0.21 |
| 30 | Vermont | VT | 1.32 | 1.24 | 0.08 |
| 31 | Arkansas | AR | 1.24 | 1.11 | 0.13 |
| 32 | Indiana | IN | 1.24 | 1.11 | 0.13 |
| 33 | Iowa | IA | 1.24 | 1.11 | 0.13 |
| 34 | Kentucky | KY | 1.24 | 1.11 | 0.13 |
| 35 | Massachusetts | MA | 1.24 | 1.11 | 0.13 |
| 36 | Michigan | MI | 1.24 | 1.11 | 0.13 |
| 37 | Minnesota | MN | 1.24 | 1.11 | 0.13 |
| 38 | Missouri | MO | 1.24 | 1.11 | 0.13 |
| 39 | Nebraska | NE | 1.24 | 1.11 | 0.13 |
| 40 | South Dakota | SD | 1.24 | 1.11 | 0.13 |
| 41 | Texas | TX | 1.24 | 1.11 | 0.13 |
| 42 | West Virginia | WV | 1.24 | 1.11 | 0.13 |
| 43 | Wisconsin | WI | 1.24 | 1.11 | 0.13 |
| 44 | Connecticut | CT | 1.11 | 1.11 | 0.00 |
| 45 | District of Columbia | DC | 1.11 | 1.11 | 0.00 |
| 46 | Illinois | IL | 1.11 | 1.11 | 0.00 |
| 47 | Kansas | KS | 1.11 | 1.11 | 0.00 |
| 48 | New York | NY | 1.11 | 1.11 | 0.00 |
| 49 | North Dakota | ND | 1.11 | 1.11 | 0.00 |
| 50 | Ohio | OH | 1.11 | 1.11 | 0.00 |
| 51 | Pennsylvania | PA | 1.11 | 1.11 | 0.00 |
In Hawaii’s case, elevated housing costs push mortgage balances sky-high. In Idaho, a surge of migrants since 2020 has driven up home prices and left many newcomers with large, fresh mortgages.
Rounding out the top five are Arizona, Colorado, and Utah (all 1.84). Once again, fast-growing markets where rising prices and younger populations translate into higher leverage.
ℹ️ Related: Hawaii has the fifth-lowest homeownership rate in the country.
States With the Lowest Household Debt
At the other end of the spectrum, Pennsylvania, Ohio, and North Dakota come in at just 1.11.
Many low-debt states share three traits. They have lower housing costs, older homeowner bases with significant equity, and slower population growth that tempers new borrowing.
However, even high-income states like Connecticut and the District of Columbia can land in this cohort thanks to well-paid residents who keep balances in check.
The gap underscores how regional housing dynamics, more than incomes alone, dictate household debt.
Finally, due to how this ratio is calculated, younger households’ true burden may be understated (student loan exclusion).
At the same time, the income measure is unemployment insurance-covered wages wages (not total personal income), which can overstate the ratio in high-capital-income areas (e.g., states with finance-heavy metros).
If you enjoyed today’s post, check out Visualizing Government Debt-to-GDP Around the World on Voronoi, the new app from Visual Capitalist.
Tyler Durden
Sat, 11/01/2025 – 21:45